Offering value-based service packages instead of individual add-ons
Background
Over the years, our team has devoted much time and energy to increasing our attachment rate (purchase of our value-added products such as windshield wipers). However, many of our ideas still revolved around the same strategy: encouraging users to “add on” these items as a separate purchase.
My role:
Lead designer & researcher
Impact:
+$5.9M annual incremental profit
+18.1% attachment rate
Tools:
Qualtrics, Maze, Figma
How might we increase VAPS attachment?
Challenges
Our strategy has always treated wipers and Rain Defense as add-ons to service, the enhancements we made to the experience only moved the needle by small amounts. Instead of keeping on this path, our team believed there was an opportunity to re-strategize our efforts and obtain big gains.

On the left: Control (Quote experience)
On the right: Test (Service packages experience)
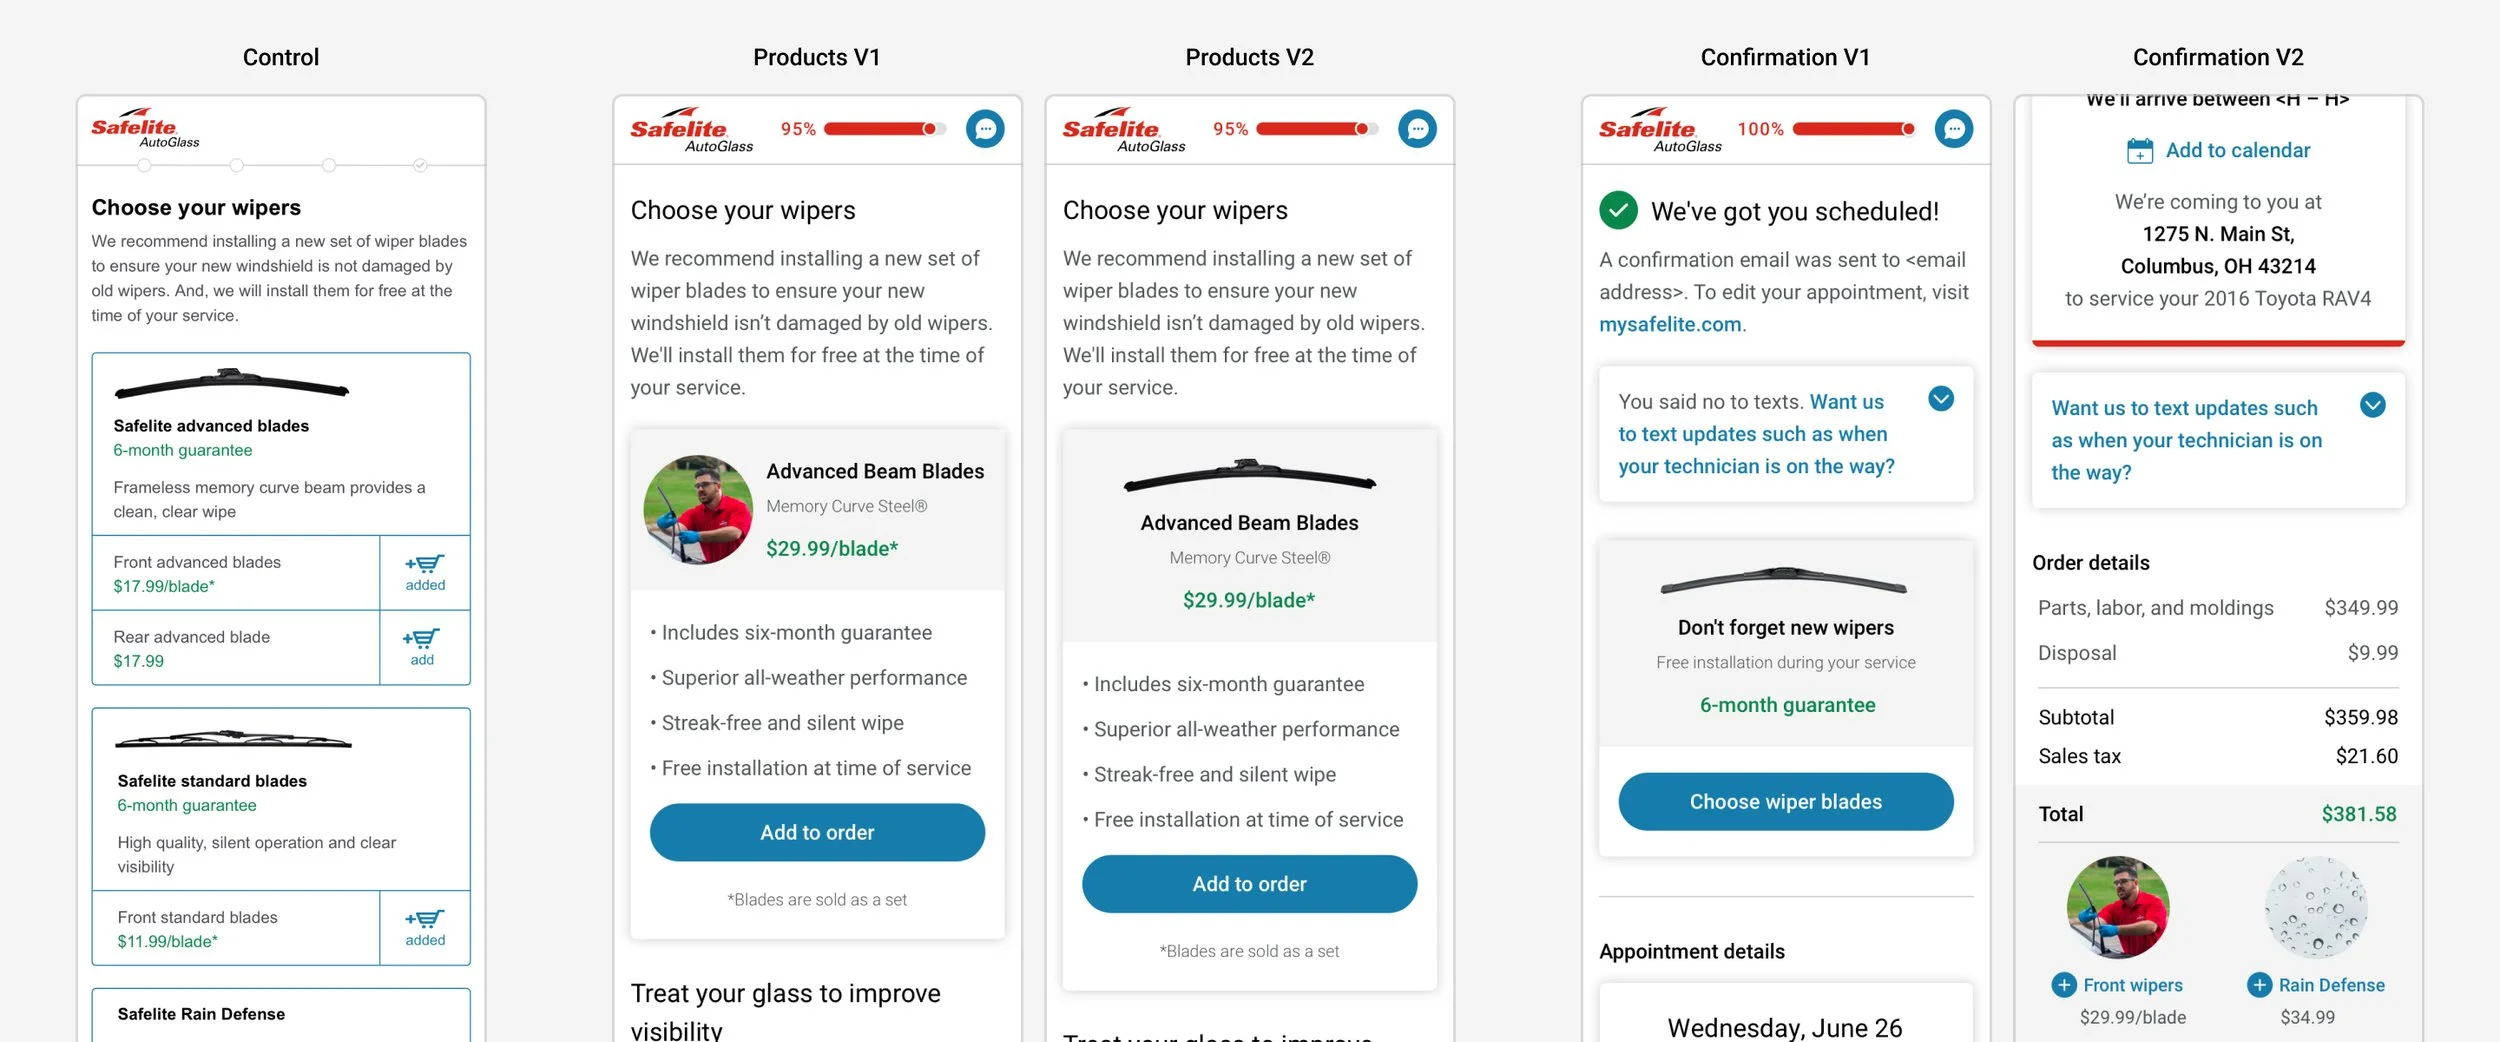
Prior to service packages, we tested and launched various enhancements to our products and confirmation page to offer an upsell

To think outside the box, our team got together to brainstorm new, big ideas and share inspiration from other companies
What is the purchase behavior of our users?
Method:
Survey
Sample size:
600
Margin of error:
4%
Confidence level:
95%
Problem statement
Out of the brainstorming, our team gravitated toward the idea of service packages. Our hypothesis was that by offering varying degrees of value-based service packages, VAPS will be treated less as an up-sell and more as a part of standard service.
Additionally, by using this tiered service strategy, we could utilize the goldilocks effect, where our lowest tier package is “too little,” our highest tier package is “too much,” but our middle package is “just right.”
However, to understand whether this strategy would be fruitful, we needed to understand our audience’s purchasing behavior and whether it mapped onto our concept.
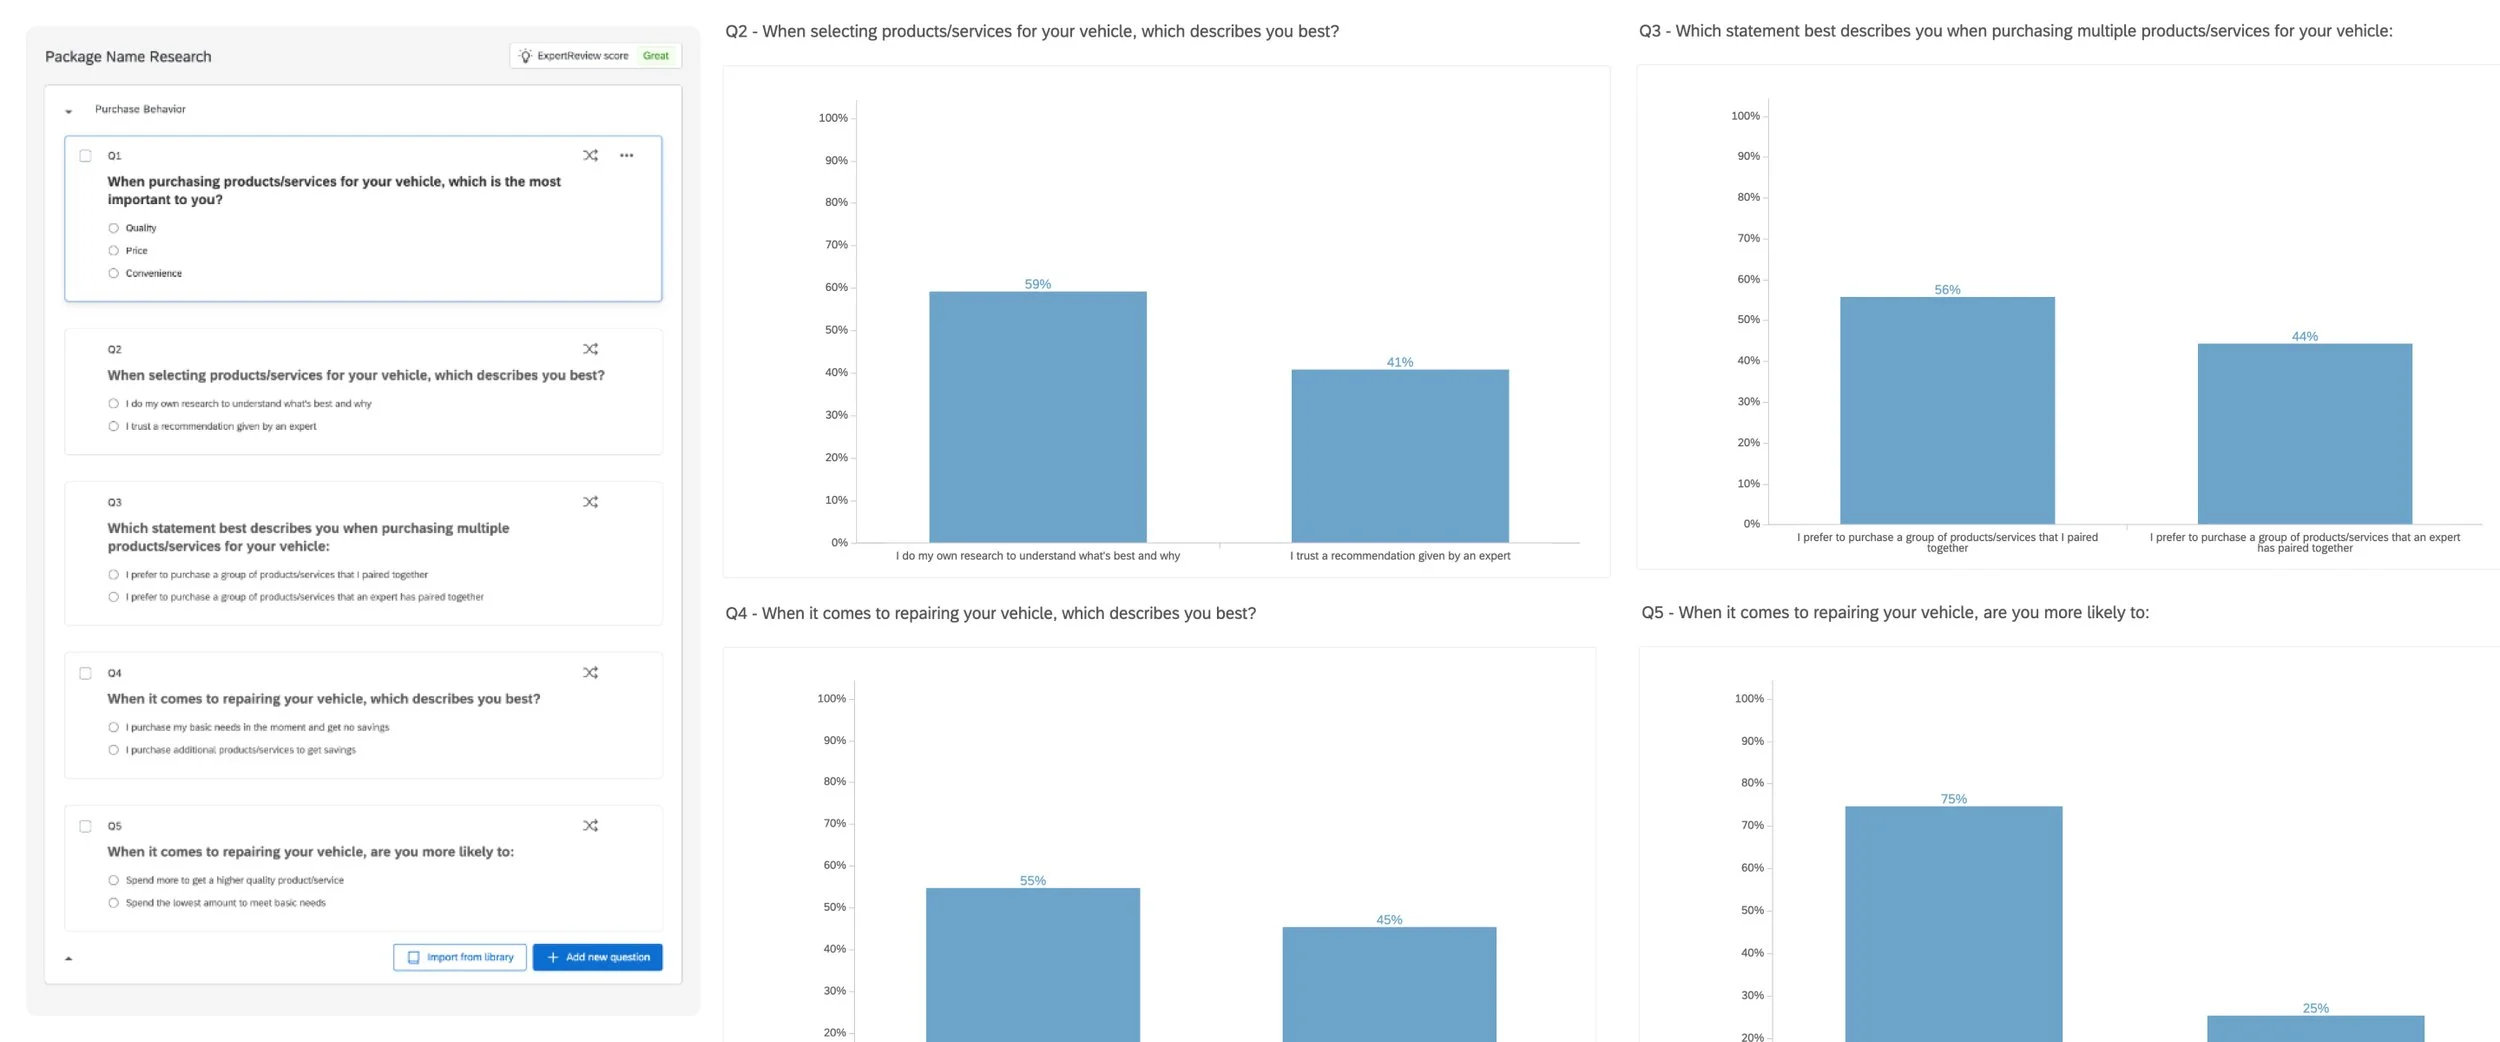
Survey results collected to validate or invalidate our new VAPS strategy
Findings
When purchasing products/services for their vehicle, the majority of users (62%) believe quality is most important compared to price and convenience
Which means: The perceived quality of packages should have a large impact
When purchasing products/services for their vehicle, 41% of users trust a recommendation given by an expert, and 44% would prefer to purchase a group of products/services that an expert paired together.
Which means: Although the majority like to do their own research/pairing, a large percentage of users look to our expertise/recommendations
75% of users would spend more to get a higher quality product/service vs. spending the lowest amount to meet their basic needs
Which means: If we provide a variety of service options, many users will be interested in the higher-quality offering(s)
Recommendations
Conceptually, the idea seemed to fit the needs of our audience and looked like it would provide guidance and confidence in the decision-making process
Next step: Dive into the specifics of the experience
What do users associate with different service names?
Method:
Survey
Sample size:
300
Margin of error:
6%
Confidence level:
95%
Problem statement
To move forward with this experience, we needed to understand what level of quality and cost users associated with different service names. This would help guide us on what to name our service packages.
Additionally, it would help us understand what perception users would have based on the words we used to describe each service.

Bar chart of the perceived quality of 20+ potential service package names

Bar chart of the perceived cost of 20+ potential service package names
Findings
Economy is perceived as the cheapest and lowest quality
Which means: This could further encourage users to select Standard service
Standard is perceived as the most average option
Which means: Users are much more likely to choose this service
Premium is the sweet spot for high-quality service
Which means: This option sits very comfortably above average, but avoids the “very/far above” labels that are attributed with names such as “Elite”
Recommendations
Understand how service names might affect behavior so we can effectively balance attachment rate and conversion rate
How do service names affect customer behavior?
Method:
Survey
Sample size:
300
Margin of error:
6%
Confidence level:
95%
Problem statement
Now that we understood what quality and cost users perceive different service names to have, we needed to understand what impact this might have on actual behavior.
To reduce cost and risk, I tested our favorite tier names to see how they performed against each other in qualitative A/B testing to give us the best shot at a successful experiment once we pushed it live for a real A/B test.
This was a crucial step in the process, as there were a lot of differing opinions from various teams and stakeholders, and research was the way to get everyone on board with a single solution that presented the best chance at success.

All of the variations tested to gauge and compare interest in upgrading (e.g. selecting a Tier 2 or Tier 3 package)

Questions from the survey which were used as a baseline to compare across all test variations
Findings
Control (Economy / Standard / Premium)
49% upgraded their package
Test A (Basic / Standard / Premium)
36% upgraded their package (–13%)
Test B (Standard / Essentials / Plus)
35% upgraded their package (–14%)
Test C (Back on the road / The Essentials / Full Service)
37% upgraded their package (–12%)
Test D (Starter / Standard / Premium)
46% upgraded their package (Flat)
Test E (Essentials / Plus / Premium)
28% upgraded their package (–21%)
Recommendations
If our first priority is to improve attachment rate:
Control and Test D variations will be most effective
If our priority is to balance attachment rate & conversion rate:
Test A, B, and C variations will have similar results to each other
Compared to the Control, these variations will likely decrease attachment rate but may improve conversion rate.
How do users react to service packages?
Method:
Unmoderated usability
Sample size:
40
Problem statement
After finalizing the tier names we wanted to move forward with, I still needed to ensure the experience would be effective. Up until this point, we’ve successfully tested the idea conceptually, but what does it look and feel like in practice?
Specifically, I needed to understand how customers might react. Can they complete tasks? Do they understand their options? Can they articulate what they’re choosing and why? Is the information clear and easy to review?
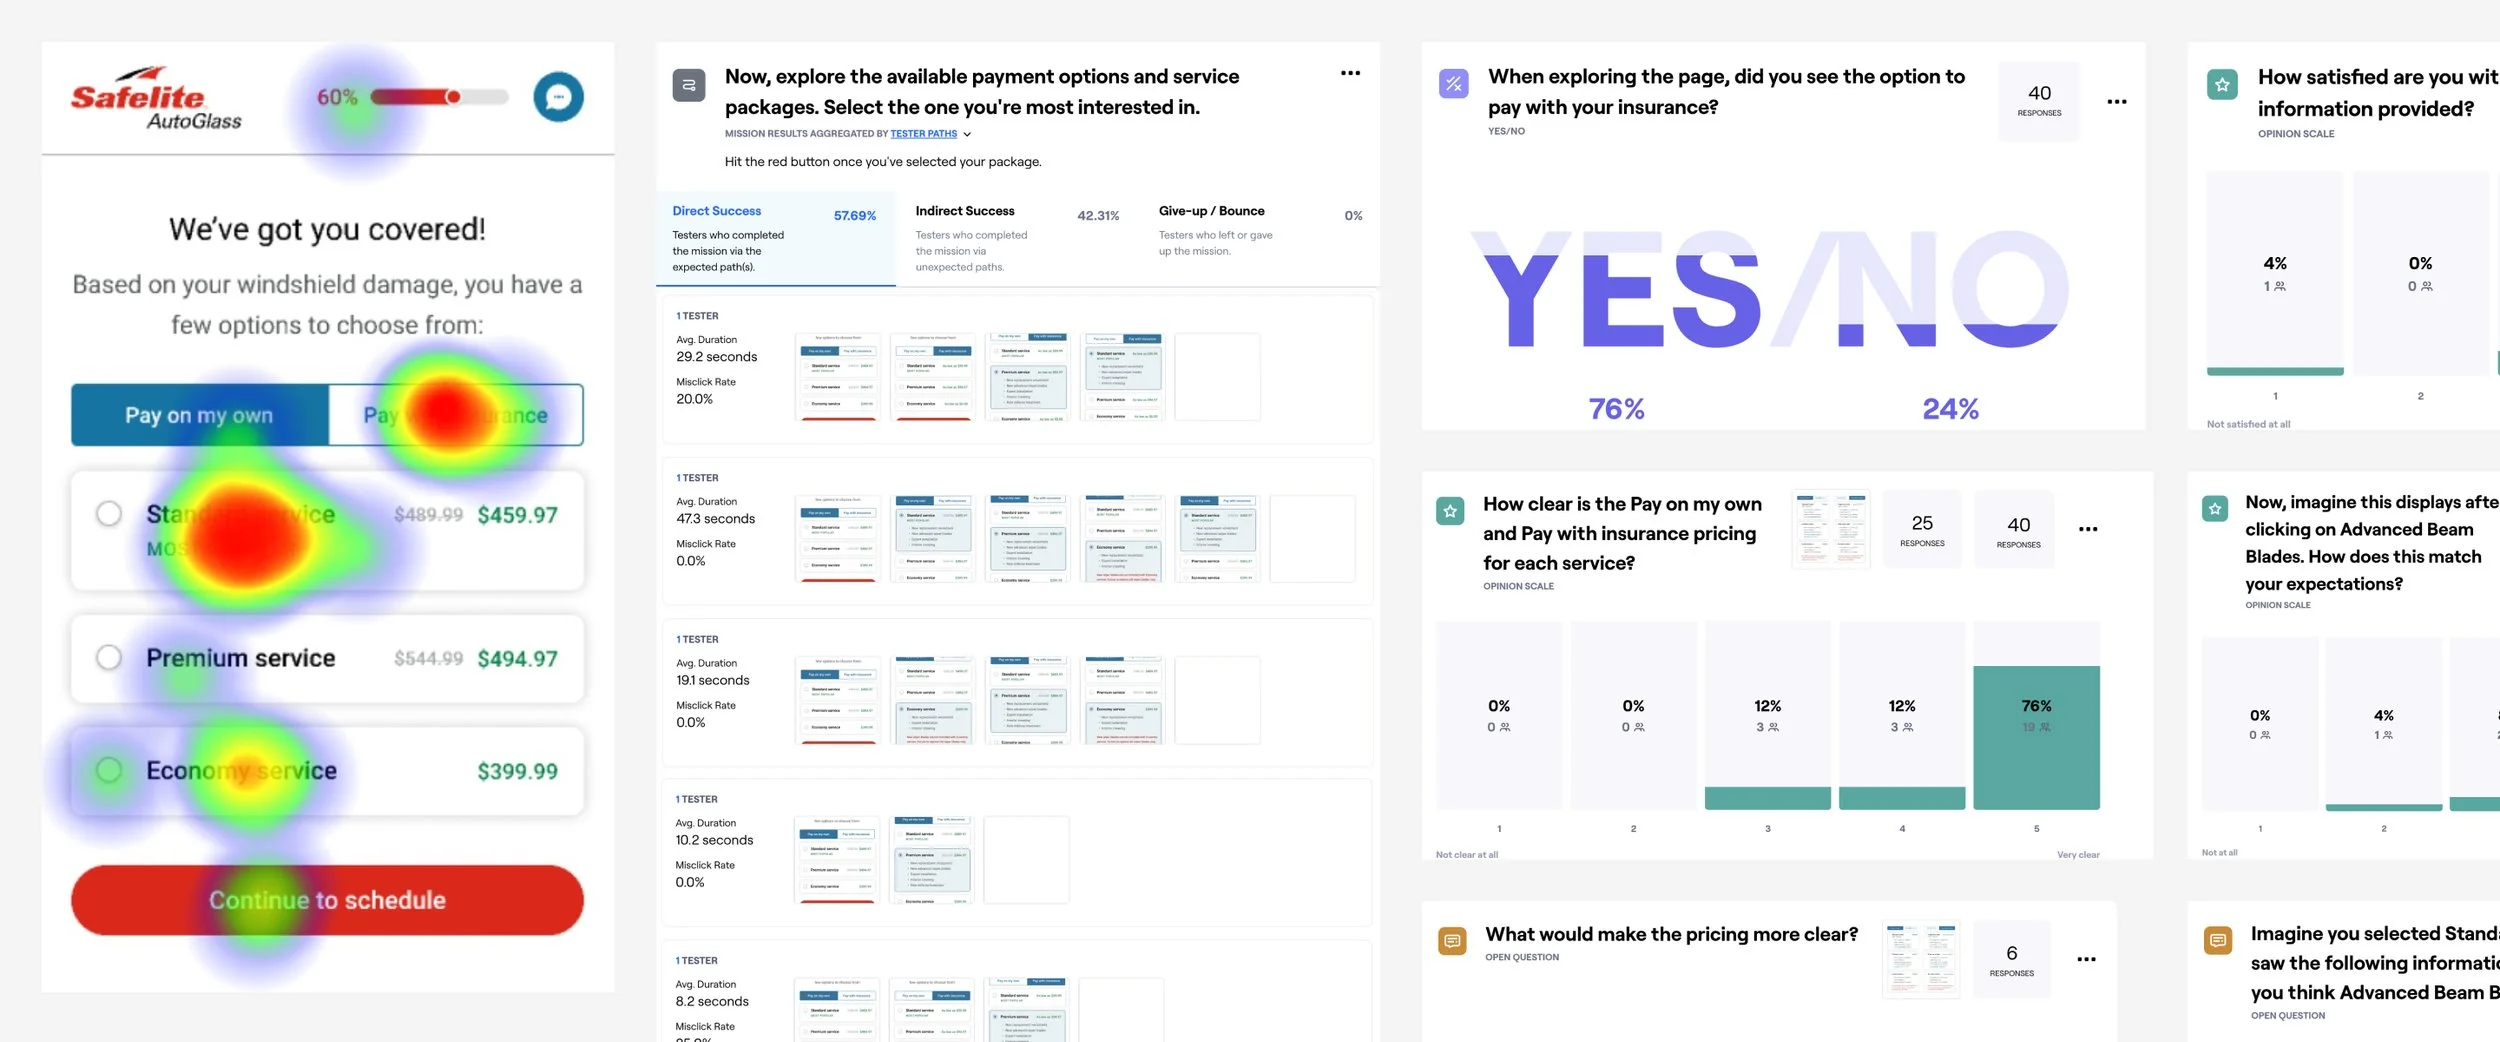
Usability findings from our unmoderated session with Maze participants
Findings
Users rated their initial reaction to the design: 4.3 out of 5
Specifically, users had a positive reaction because: (1) Price transparency, (2) Clearly laid out, (3) Variety of options, and (4) Visually eye-catching
All users (100%) successfully completed the tasks
Vast majority (96%) found reviewing the packages to be easy
Vast majority (96%) thought the benefits of each package were clear
Vast majority (92%) thought the pricing for cash/insurance was clear
Recommendations
Offer the service packages experience to our users with Economy / Standard / Premium packages.
Explore additional labels for the packages to provide further guidance (e.g. Most Popular, Best Deal, Best Rated, etc.)
Explore auto-expanding the packages on mobile to help users compare multiple packages at the same time
Impact
After finalizing the concept, language, and visuals based on our research findings, we tested the service packages experience against our Control.
Our final hypothesis was by treating VAPS less as an up-sell and more as a part of standard service, we could increase attachment rate while retaining a flat conversion rate.
Service Packages V1
Profit: $5.9M
Wiper attachment: +16.8%
Rain Defense attachment: +1.3%

From left to right: (1) initial page load, (2) Cash + Economy package selection, (3) Insurance + Standard package selection
Team
Lead Designer & Researcher: Me 👩💻
Product Manager: Lindsay Stout
UX Writer: Laura Lampe
Data Analyst: Cody Francis & Jesse Weber
Director of UX: Jordan Monson
Director of Product: Tim Simeone
AVP of VAPS: Kristen Stovell